Data science isn’t your typical, neatly defined field; it’s a blend of various disciplines such as computer science, mathematics, and statistics. Its versatility allows it to be applied across numerous domains, requiring expertise in each specific area. For instance, developing a medical analysis application necessitates collaboration with medical professionals to ensure accurate system definition and result interpretation.
Data scientists dive into data, crafting visualizations and crunching vital statistics. From there, they construct machine learning models to uncover patterns. Machine learning and deep learning fall under the umbrella of data science.
Data scientists dive into data, crafting visualizations and crunching vital statistics. From there, they construct machine learning models to uncover patterns. Machine learning and deep learning fall under the umbrella of data science.
Now, you might wonder about the distinctions between data science, data analytics, and big data. Big data entails vast volumes of diverse data, distinguished by its four Vs: volume, velocity, variety, and veracity. Meanwhile, data analytics focuses on extracting insights through statistical calculations and visualizations, akin to descriptive statistics.
But why the focus on data science now? Three key factors play into it: the unprecedented abundance of data, enhanced computational power, and the evolution of sophisticated algorithms for pattern recognition and machine learning.
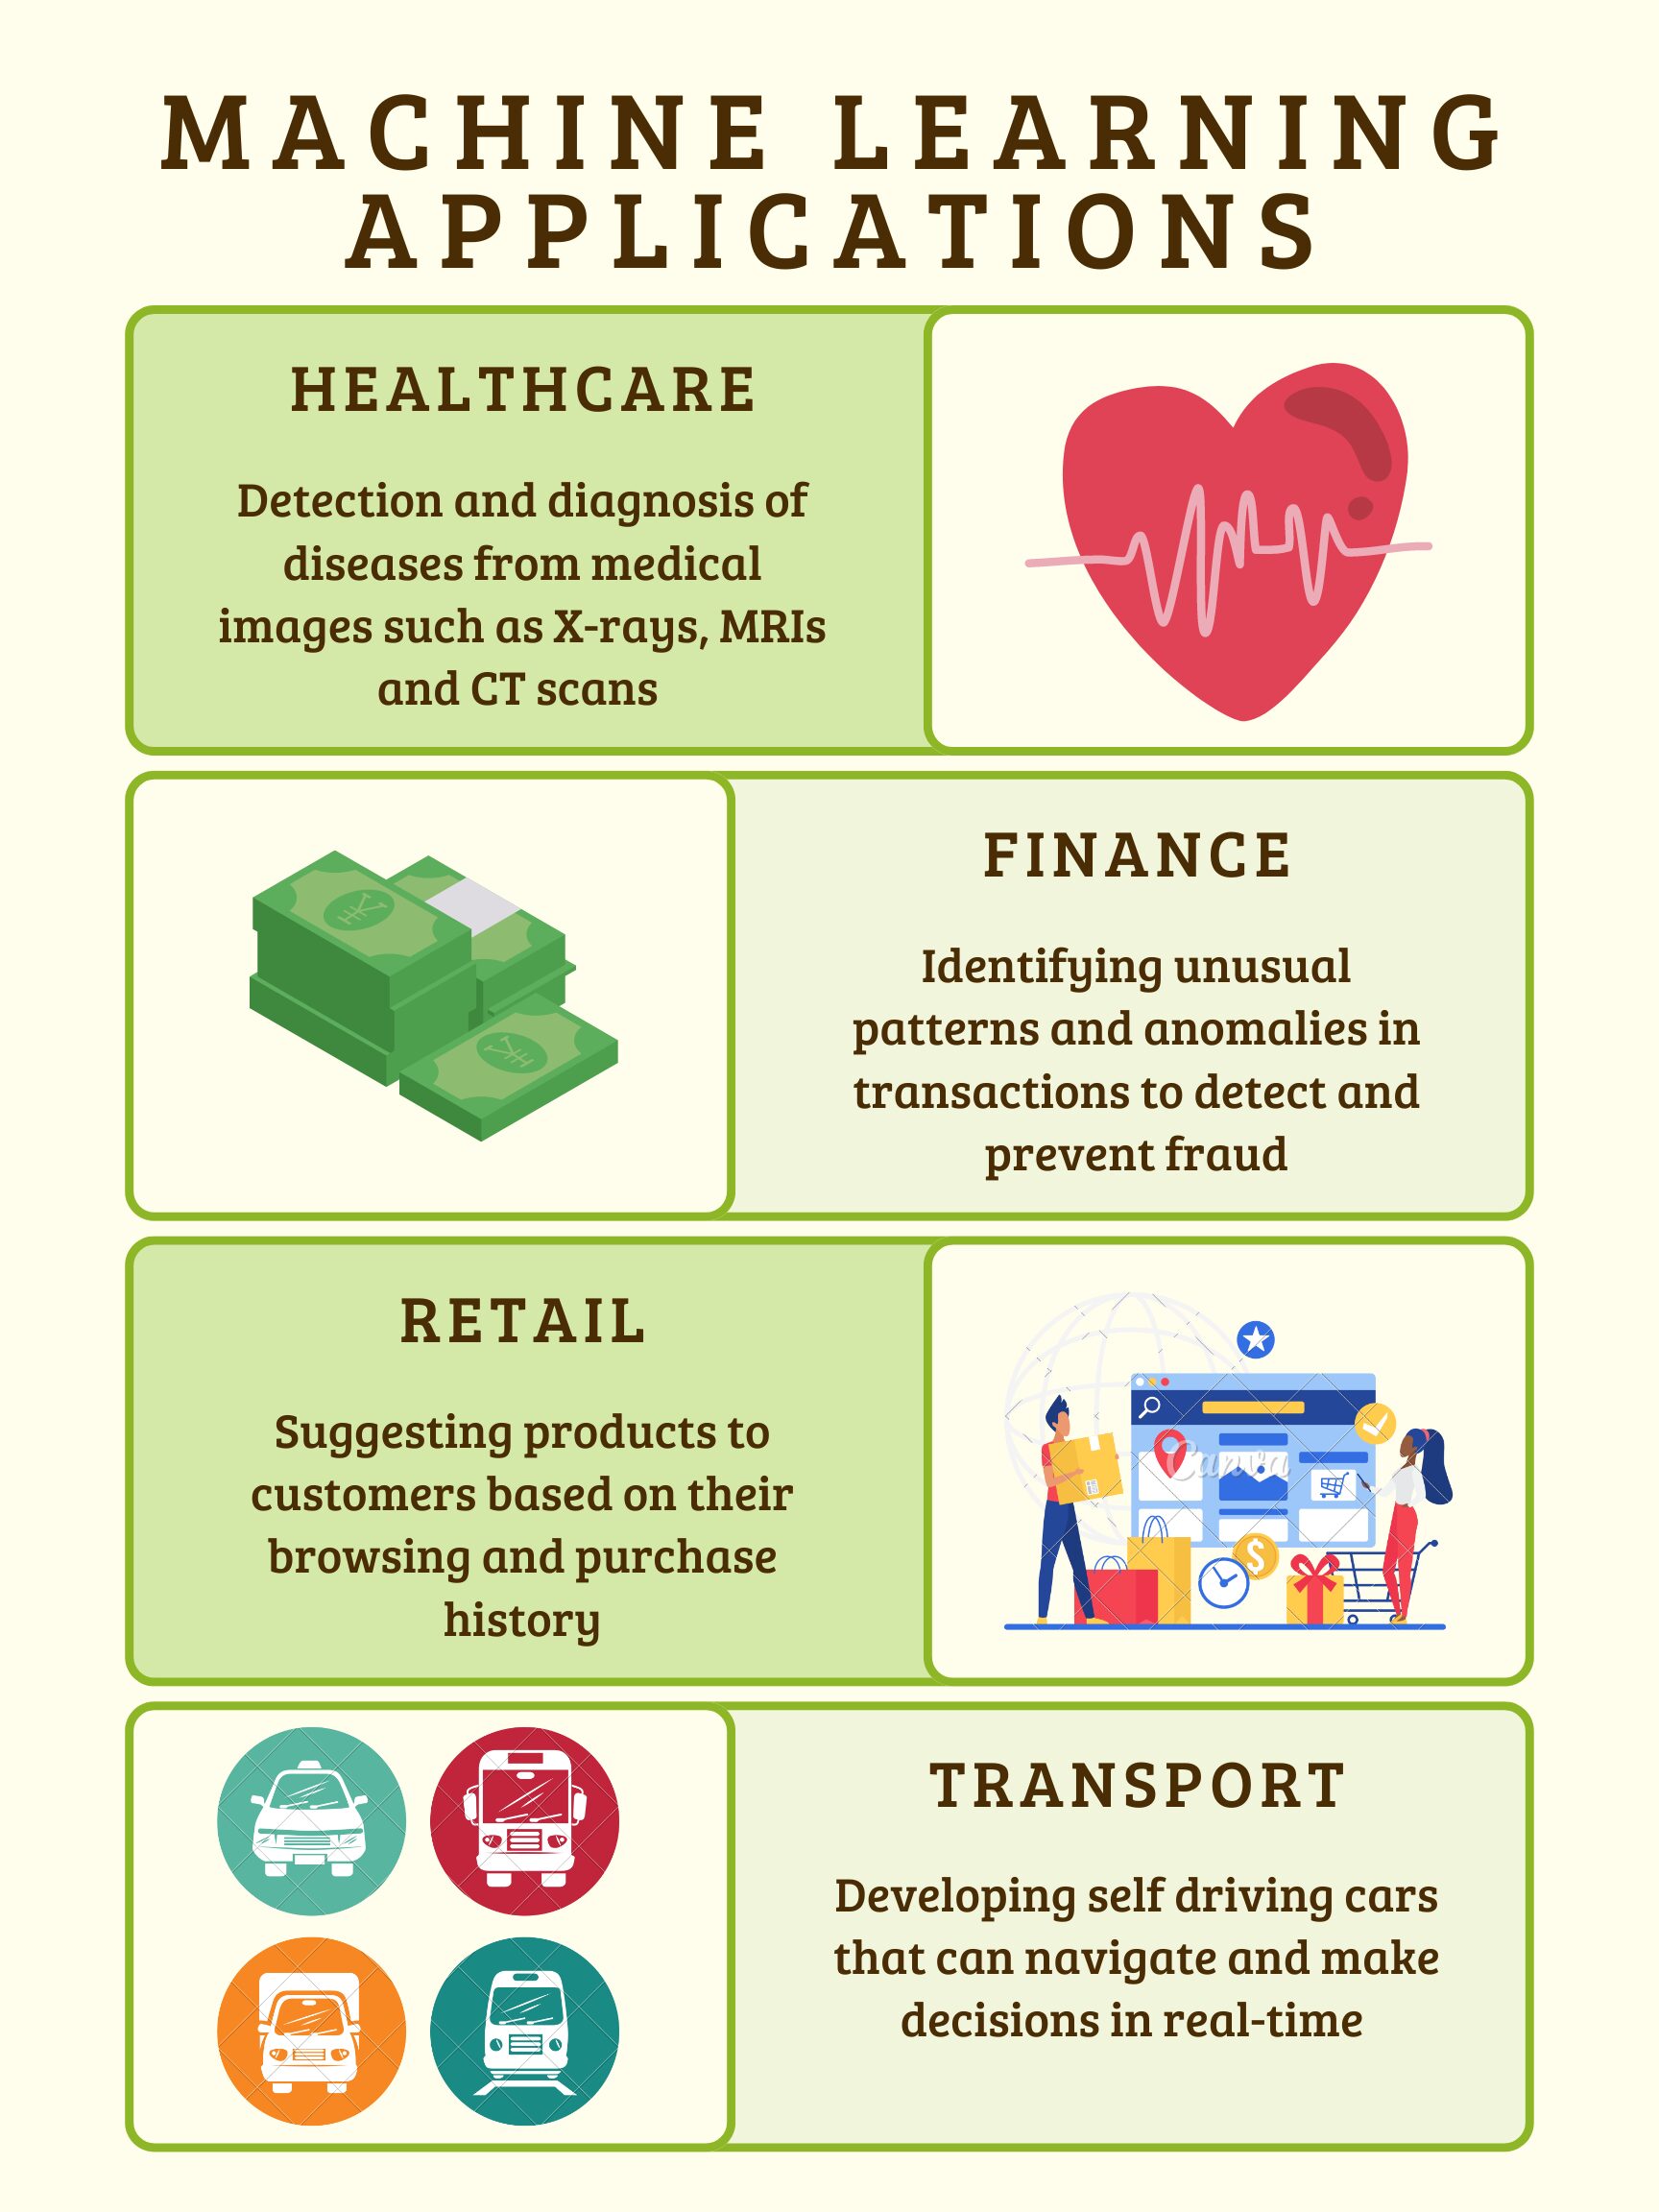 The applications of data science and machine learning are ubiquitous, spanning healthcare, finance, transportation, social media, e-commerce, and virtual assistant apps. For instance, in healthcare, machine learning aids in disease diagnosis and drug discovery, while in finance, it powers predictive algorithms for customer defaults and fraud detection.
Social media platforms utilize machine learning for spam filtering and sentiment analysis, while e-commerce giants leverage it for personalized recommendations and customer support. Even virtual assistant apps, like chatbots, are powered by machine learning to intelligently respond to user inquiries.
As for the history of data science, the term emerged decades ago but gained prominence only recently. Looking ahead, cloud services offer immense potential for advancing machine learning applications across various sectors, potentially bringing once-fictional technologies like assistant robots and self-driving cars into our daily lives.
Regarding the future of data scientists, the demand is soaring, with lucrative opportunities and high-paying jobs awaiting skilled professionals. Learning data science could be a game-changer…..
Common terms used in Data Science
Data, Observations and Variables
Data serves as the foundation of modern computing, with the ability to store and process vast collections of information ranging from numbers to words. In a nutshell, data encompasses facts, measurements, observations, and various other forms of input that can be feasibly processed by computers.
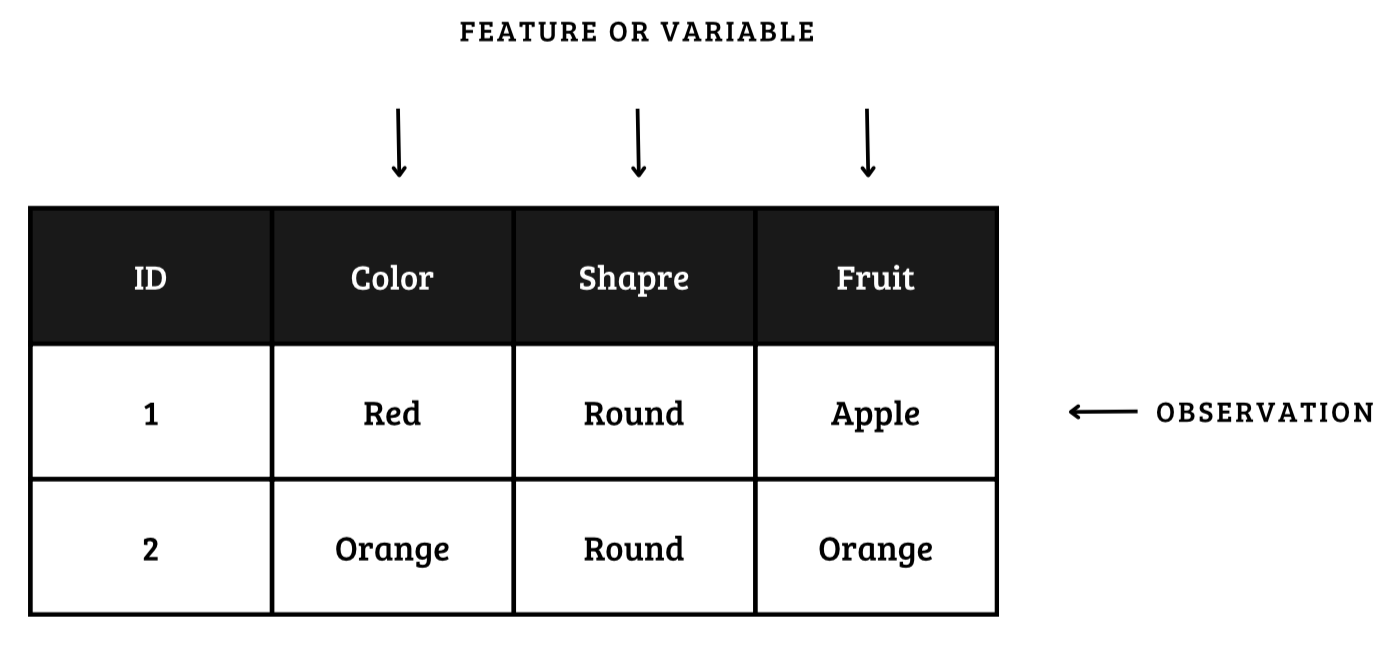
When it comes to organizing data, a common practice is to structure it in columns and rows. Each row typically represents a distinct observation or case, while each column is dedicated to a specific feature or variable. This systematic arrangement allows for efficient data processing and analysis.
In the realm of variables, there exist two primary categories: numerical and categorical. Numerical variables are characterized by their quantifiable nature, enabling computations like mean calculations. On the other hand, categorical variables involve non-numeric values such as labels, which do not lend themselves to statistical operations like determining the mean.
For predictive analytics, understanding the distinction between dependent and independent variables is crucial. Dependent variables are the targets of prediction, while independent variables (or X variables) serve as the predictors influencing the outcome (Y variable). It’s imperative that independent variables remain unrelated to each other to maintain the integrity of predictions.
y = f(x)
Population and Samples
In the domain of data science, the concepts of population and sample play a pivotal role. The entirety of data points constitutes the population, yet practical constraints necessitate working with representative samples. By selecting a sample that mirrors the population characteristics, data scientists can make inferences and predictions with confidence.
Machine learning algorithms are designed to derive parameters from samples that effectively generalize to the broader population. This process involves mapping relationships learned from the sample data to the entire population, highlighting the importance of selecting an appropriate sample using sound sampling techniques.

In essence, the effective utilization of data science concepts like population, sample selection, and variable types empowers analysts and data scientists to draw meaningful insights and predictions from data.
Outliers and Missing data
In the realm of data science, after delving into the concepts of population and sampling techniques, let’s shift our focus to the critical aspects of outliers and handling missing data. An outlier, as the term suggests, is a data point that deviates significantly from the majority of observations within a dataset. This aberration may stem from measurement variability or experimental errors, potentially skewing the performance of machine learning algorithms.
Visualizing data is a powerful technique for outlier detection, allowing analysts to pinpoint anomalies that stand out from the general pattern. Consider an example where two cases exhibit outlier characteristics as shown in the diagram below.

Dealing with outliers can involve various strategies such as
- outright removal i.e. to drop them altogether
- capping values with a threshold
- assign new values based on dataset statistics e.g. replace with the mean, median or mode of the dataset
- transforming the dataset itself to mitigate their impact
Addressing missing data poses another challenge in data analysis. One approach is the removal of observations with missing values, albeit at the cost of potentially losing valuable information. Alternatively, data imputation techniques come into play, enabling analysts to fill in missing values effectively.
For numeric features, imputation can involve substituting missing values with the mean, median, or mode of the dataset, or randomly selecting observations to derive replacement values. Another sophisticated technique entails regressing the missing feature against other variables to predict and fill in the absent value.
In cases where categorical features exhibit missing values, imputation methods include replacing them with the mode (most frequent value) or employing models like K-Nearest Neighbors (KNN) to predict the missing values based on the dataset’s existing information.
Successfully navigating outliers and missing data challenges in data science demands a nuanced approach that balances data integrity and analytical robustness. By leveraging outlier detection methodologies and strategic imputation techniques, analysts can enhance the quality and reliability of insights drawn from diverse datasets.